Family, Friend, and Community Support
The Family, Friend, and Community Support factor examines aging adult support systems that provide any type of care, and respite/relief from caregiving activities for aging adults who may be providing some sort of support or care for another individual. Additionally, the percentage of aging adults receiving support was assessed and evaluated in terms of receiving the amount of support needed.
Indicators:
Click to view demographic options
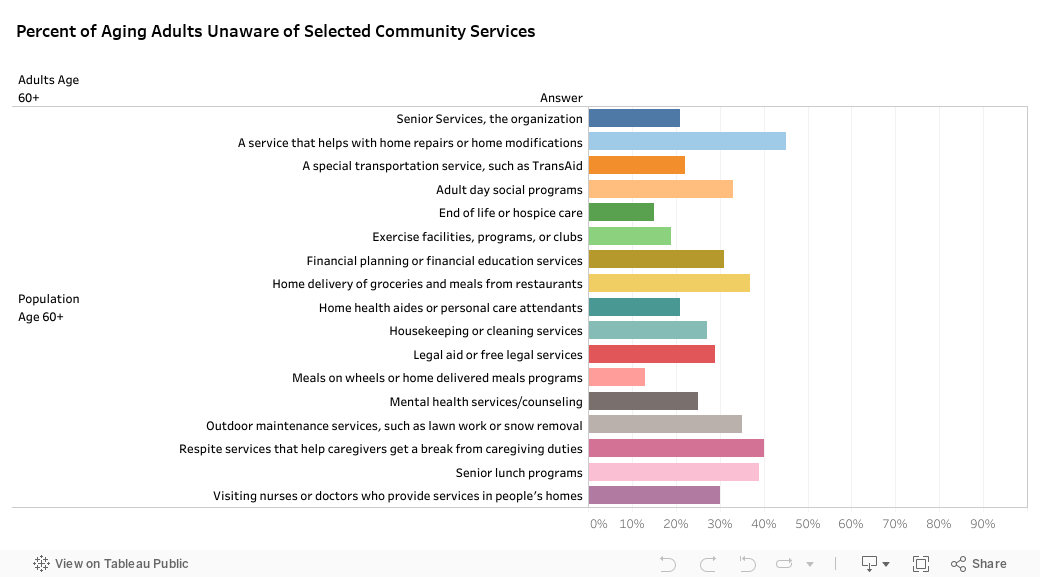
| Service | Black or African American | White | Female | Male | Less than $20,000 | $20,000 to less than $35,000 | Greater than $35,000 | ||
|---|---|---|---|---|---|---|---|---|---|
| Meals on wheels or home delivered meals programs | 14% | 12% | 11% | 15% | 19% | 13% | 8% | ||
| End of life or hospice care | 21% | 14% | 15% | 16% | 22% | 19% | 9% | ||
| Exercise facilities, programs, or clubs | 25% | 17% | 18% | 20% | 28% | 30% | 10% | ||
| Home health aides or personal care attendants | 21% | 21% | 18% | 25% | 25% | 26% | 17% | ||
| Senior Services, the organization | 26% | 20% | 18% | 26% | 31% | 23% | 18% | ||
| A special transportation service, such as TransAid | 11% | 25% | 19% | 26% | 25% | 19% | 20% | ||
| Mental health services/counseling | 26% | 25% | 24% | 26% | 34% | 27% | 19% | ||
| Housekeeping or cleaning services | 40% | 24% | 28% | 26% | 38% | 37% | 19% | ||
| Legal aid or free legal services | 30% | 29% | 29% | 30% | 40% | 33% | 22% | ||
| Visiting nurses or doctors who provide services in people's homes | 35% | 29% | 30% | 30% | 38% | 35% | 25% | ||
| Financial planning or financial education services | 39% | 29% | 30% | 33% | 49% | 37% | 20% | ||
| Adult day social programs | 36% | 32% | 31% | 36% | 43% | 37% | 26% | ||
| Outdoor maintenance services, such as lawn work or snow removal | 48% | 32% | 35% | 35% | 51% | 42% | 30% | ||
| Home delivery of groceries and meals from restaurants | 51% | 34% | 39% | 35% | 59% | 42% | 24% | ||
| Senior lunch programs | 35% | 40% | 36% | 43% | 46% | 41% | 34% | ||
| Respite services that help caregivers get a break from caregiving duties | 43% | 39% | 35% | 48% | 48% | 43% | 35% | ||
| A service that helps with home repairs or home modifications | 51% | 44% | 47% | 43% | 55% | 51% | 40% |
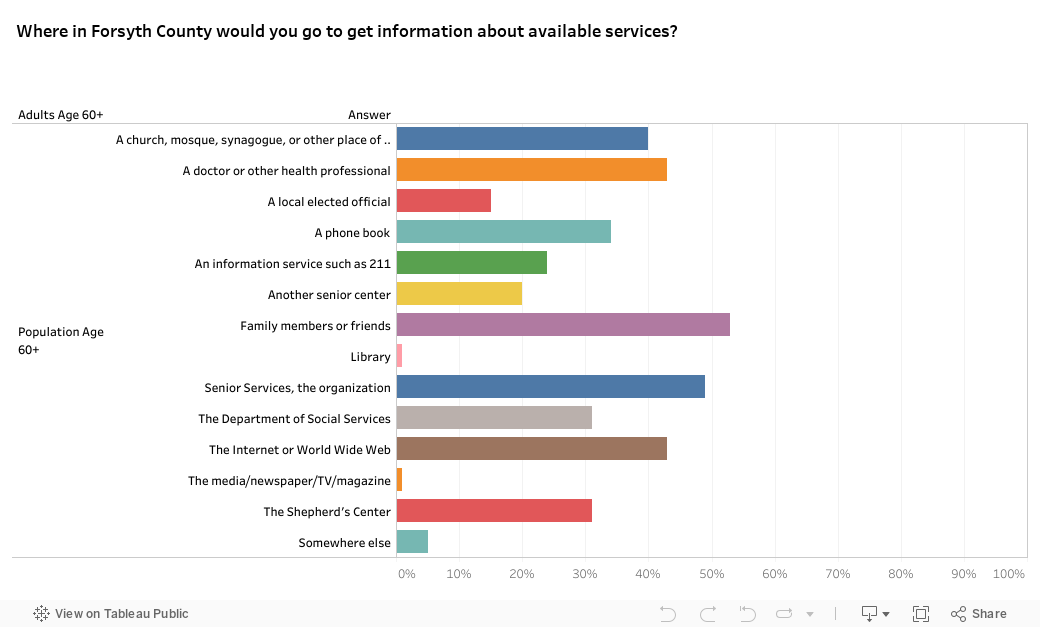
Click to view demographic options
| Place | Black or African American | White | Female | Male | Less than $20,000 | $20,000 to less than $35,000 | Greater than $35,000 | ||
|---|---|---|---|---|---|---|---|---|---|
| Family members or friends | 54% | 54% | 59% | 46% | 61% | 54% | 52% | ||
| Senior Services, the organization | 57% | 47% | 56% | 39% | 60% | 57% | 46% | ||
| The Internet or World Wide Web | 37% | 44% | 40% | 48% | 35% | 44% | 51% | ||
| A doctor or other health professional | 42% | 43% | 43% | 41% | 49% | 44% | 43% | ||
| A church, mosque, synagogue, or other place of worship | 48% | 39% | 41% | 39% | 48% | 38% | 40% | ||
| A phone book | 40% | 33% | 34% | 35% | 39% | 34% | 33% | ||
| The Department of Social Services | 41% | 29% | 32% | 30% | 44% | 36% | 29% | ||
| The Shepherd's Center | 34% | 30% | 36% | 23% | 35% | 34% | 29% | ||
| An information service such as 211 | 34% | 21% | 26% | 21% | 27% | 27% | 24% | ||
| Another senior center | 27% | 19% | 23% | 16% | 26% | 23% | 21% | ||
| A local elected official | 21% | 14% | 15% | 16% | 19% | 10% | 18% | ||
| Library | 1% | 1% | 1% | 1% | 0% | 0% | 2% | ||
| The media/newspaper/TV/magazine | 1% | 1% | 1% | 0% | 1% | 0% | 1% | ||
| Somewhere else | 8% | 3% | 4% | 5% | 5% | 5% | 3% |

What is your perception of the aging adult service system in Forsyth County?
- Central service system needed
- One number to call for information
- People aren’t sure where to go for information
- Services need expansion
- Services are costly
Click to view demographic options
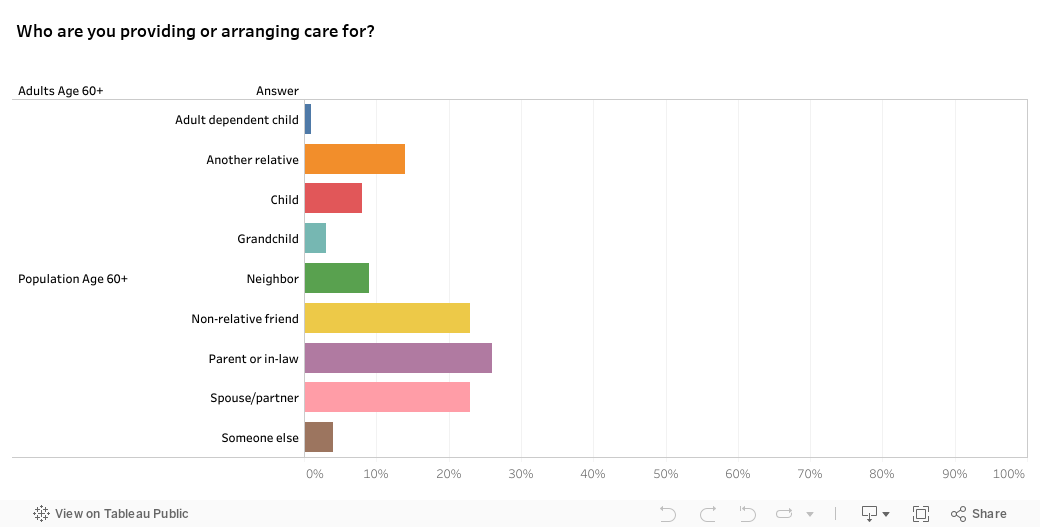
| Person | 60-64 | 65-74 | 75+ | Black or African American | White | Female | Male | Less than $20,000 | $20,000 to less than $35,000 | Greater than $35,000 | |||
|---|---|---|---|---|---|---|---|---|---|---|---|---|---|
| Spouse/partner | 13% | 21% | 36% | 13% | 25% | 19% | 27% | 8% | 23% | 28% | |||
| Parent or in-law | 51% | 19% | 9% | 31% | 25% | 30% | 21% | 34% | 31% | 23% | |||
| Child | 8% | 8% | 8% | 8% | 8% | 6% | 1% | 7% | 11% | 8% | |||
| Grandchild | 7% | 1% | 4% | 2% | 3% | 3% | 3% | 1% | 3% | 5% | |||
| Custodial grandchild, niece, or nephew | 0% | 0% | 1% | 1% | 0% | 1% | 0% | 1% | 0% | 0% | |||
| Adult dependent child | 0% | 2% | 1% | 1% | 1% | 2% | 0% | 0% | 1% | 1% | |||
| Another relative | 7% | 17% | 16% | 20% | 13% | 14% | 14% | 18% | 11% | 12% | |||
| Non-relative friend | 26% | 23% | 2% | 26% | 23% | 22% | 25% | 29% | 15% | 25% | |||
| Neighbor | 4% | 1% | 15% | 11% | 9% | 12% | 6% | 16% | 8% | 8% | |||
| Someone else | 0% | 6% | 4% | 2% | 4% | 4% | 4% | 1% | 1% | 2% |
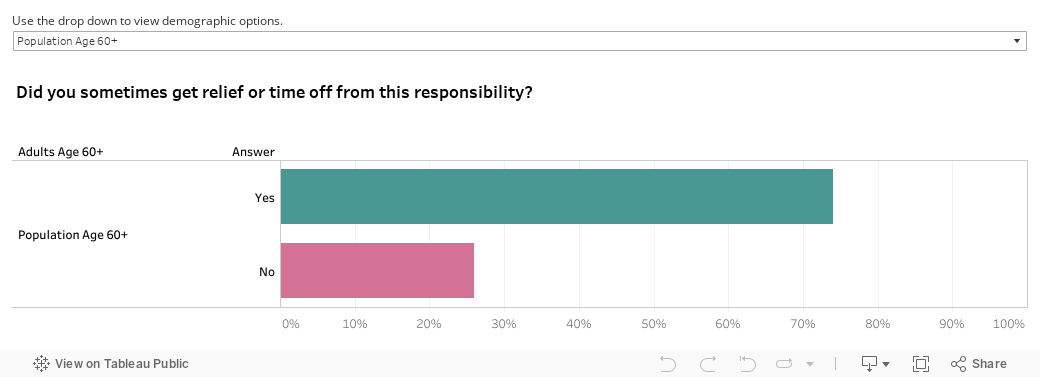

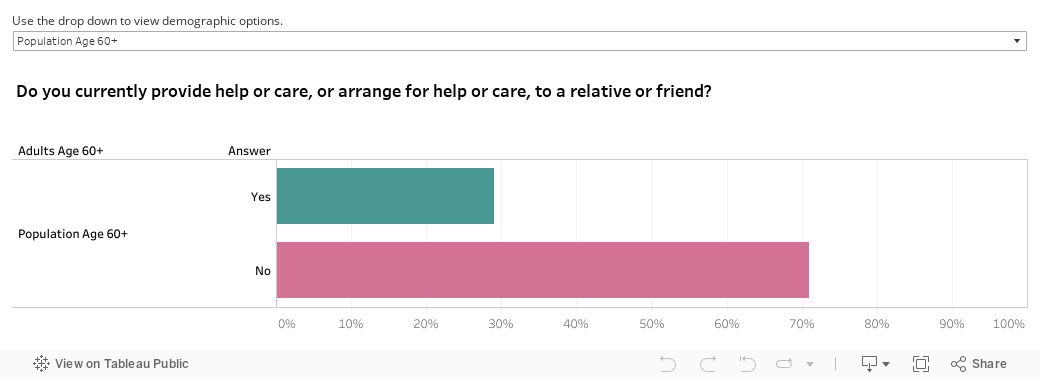
29% of adults aged 60 and older are provide some sort of care for another. 26% of people providing care for another are not getting relief or time off from their caregiving responsibilities. When we look at the data by age, we see significant differences across all age groups in terms of not getting relief or time off, with the highest percentage being adults aged 75 or older. When we look at the data by gender, we see a higher percentage of males not getting relief compared to females.
What do you think prevents caregivers from obtaining the relief they need from their caregiving responsibilities? Do you think there are enough services available in Forsyth County to help with this issue?
- Guilt
- Lack of trust
- Lack of availability and high cost of caregiver relief services
- Unawareness of resources
- Pride or difficulty in asking for help
- More caregiver support groups are needed
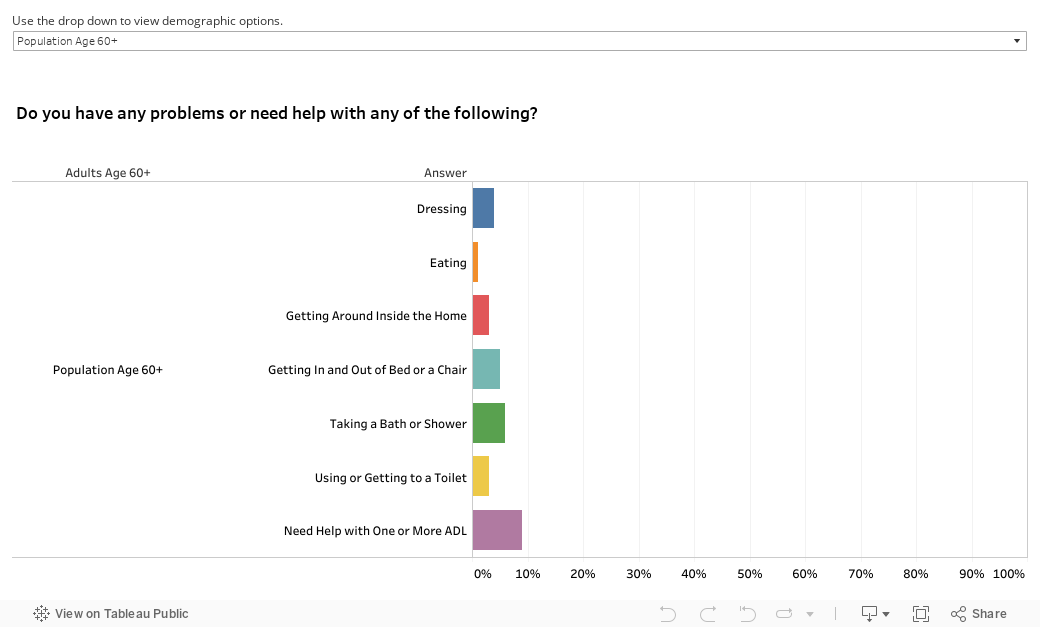
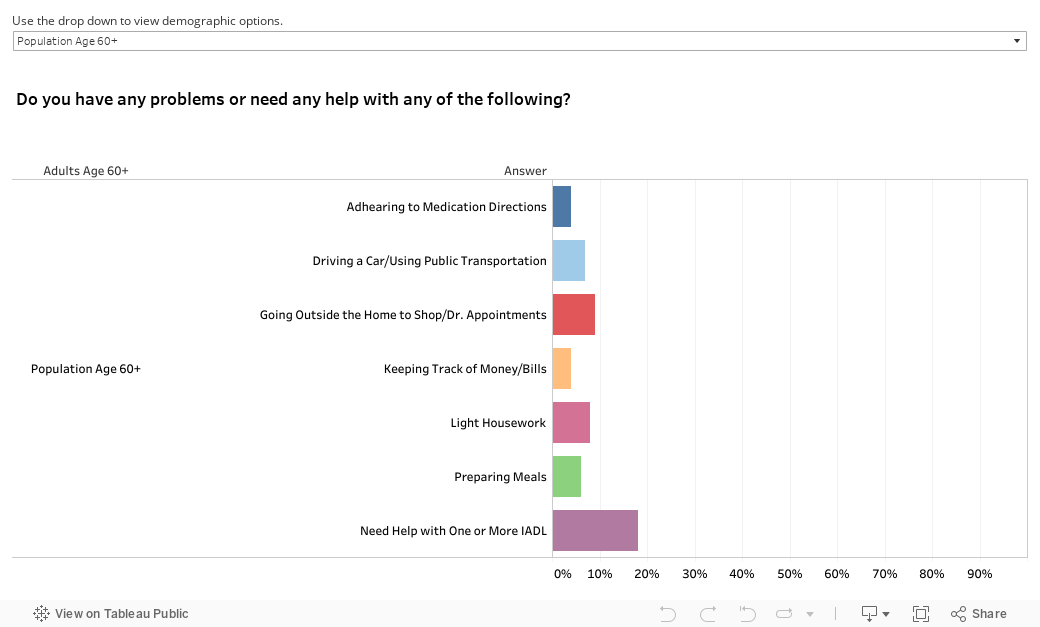
27% of adults aged 60 and older need help or assistance with one or more activity of daily living or instrumental activity of daily living.