Age-Friendly Forsyth’s research process in 2017 engaged three collaborative work groups—Data, Survey, and Best Practices, as well as overarching Steering and Advisory committees. Over 100 organizational and community members have participated in this process. Members of the work groups focused on:
- publicly available data
- determining factors that affect quality of life
- implementation of a telephone survey of 1002 adults aged 60 and older
- best practices research
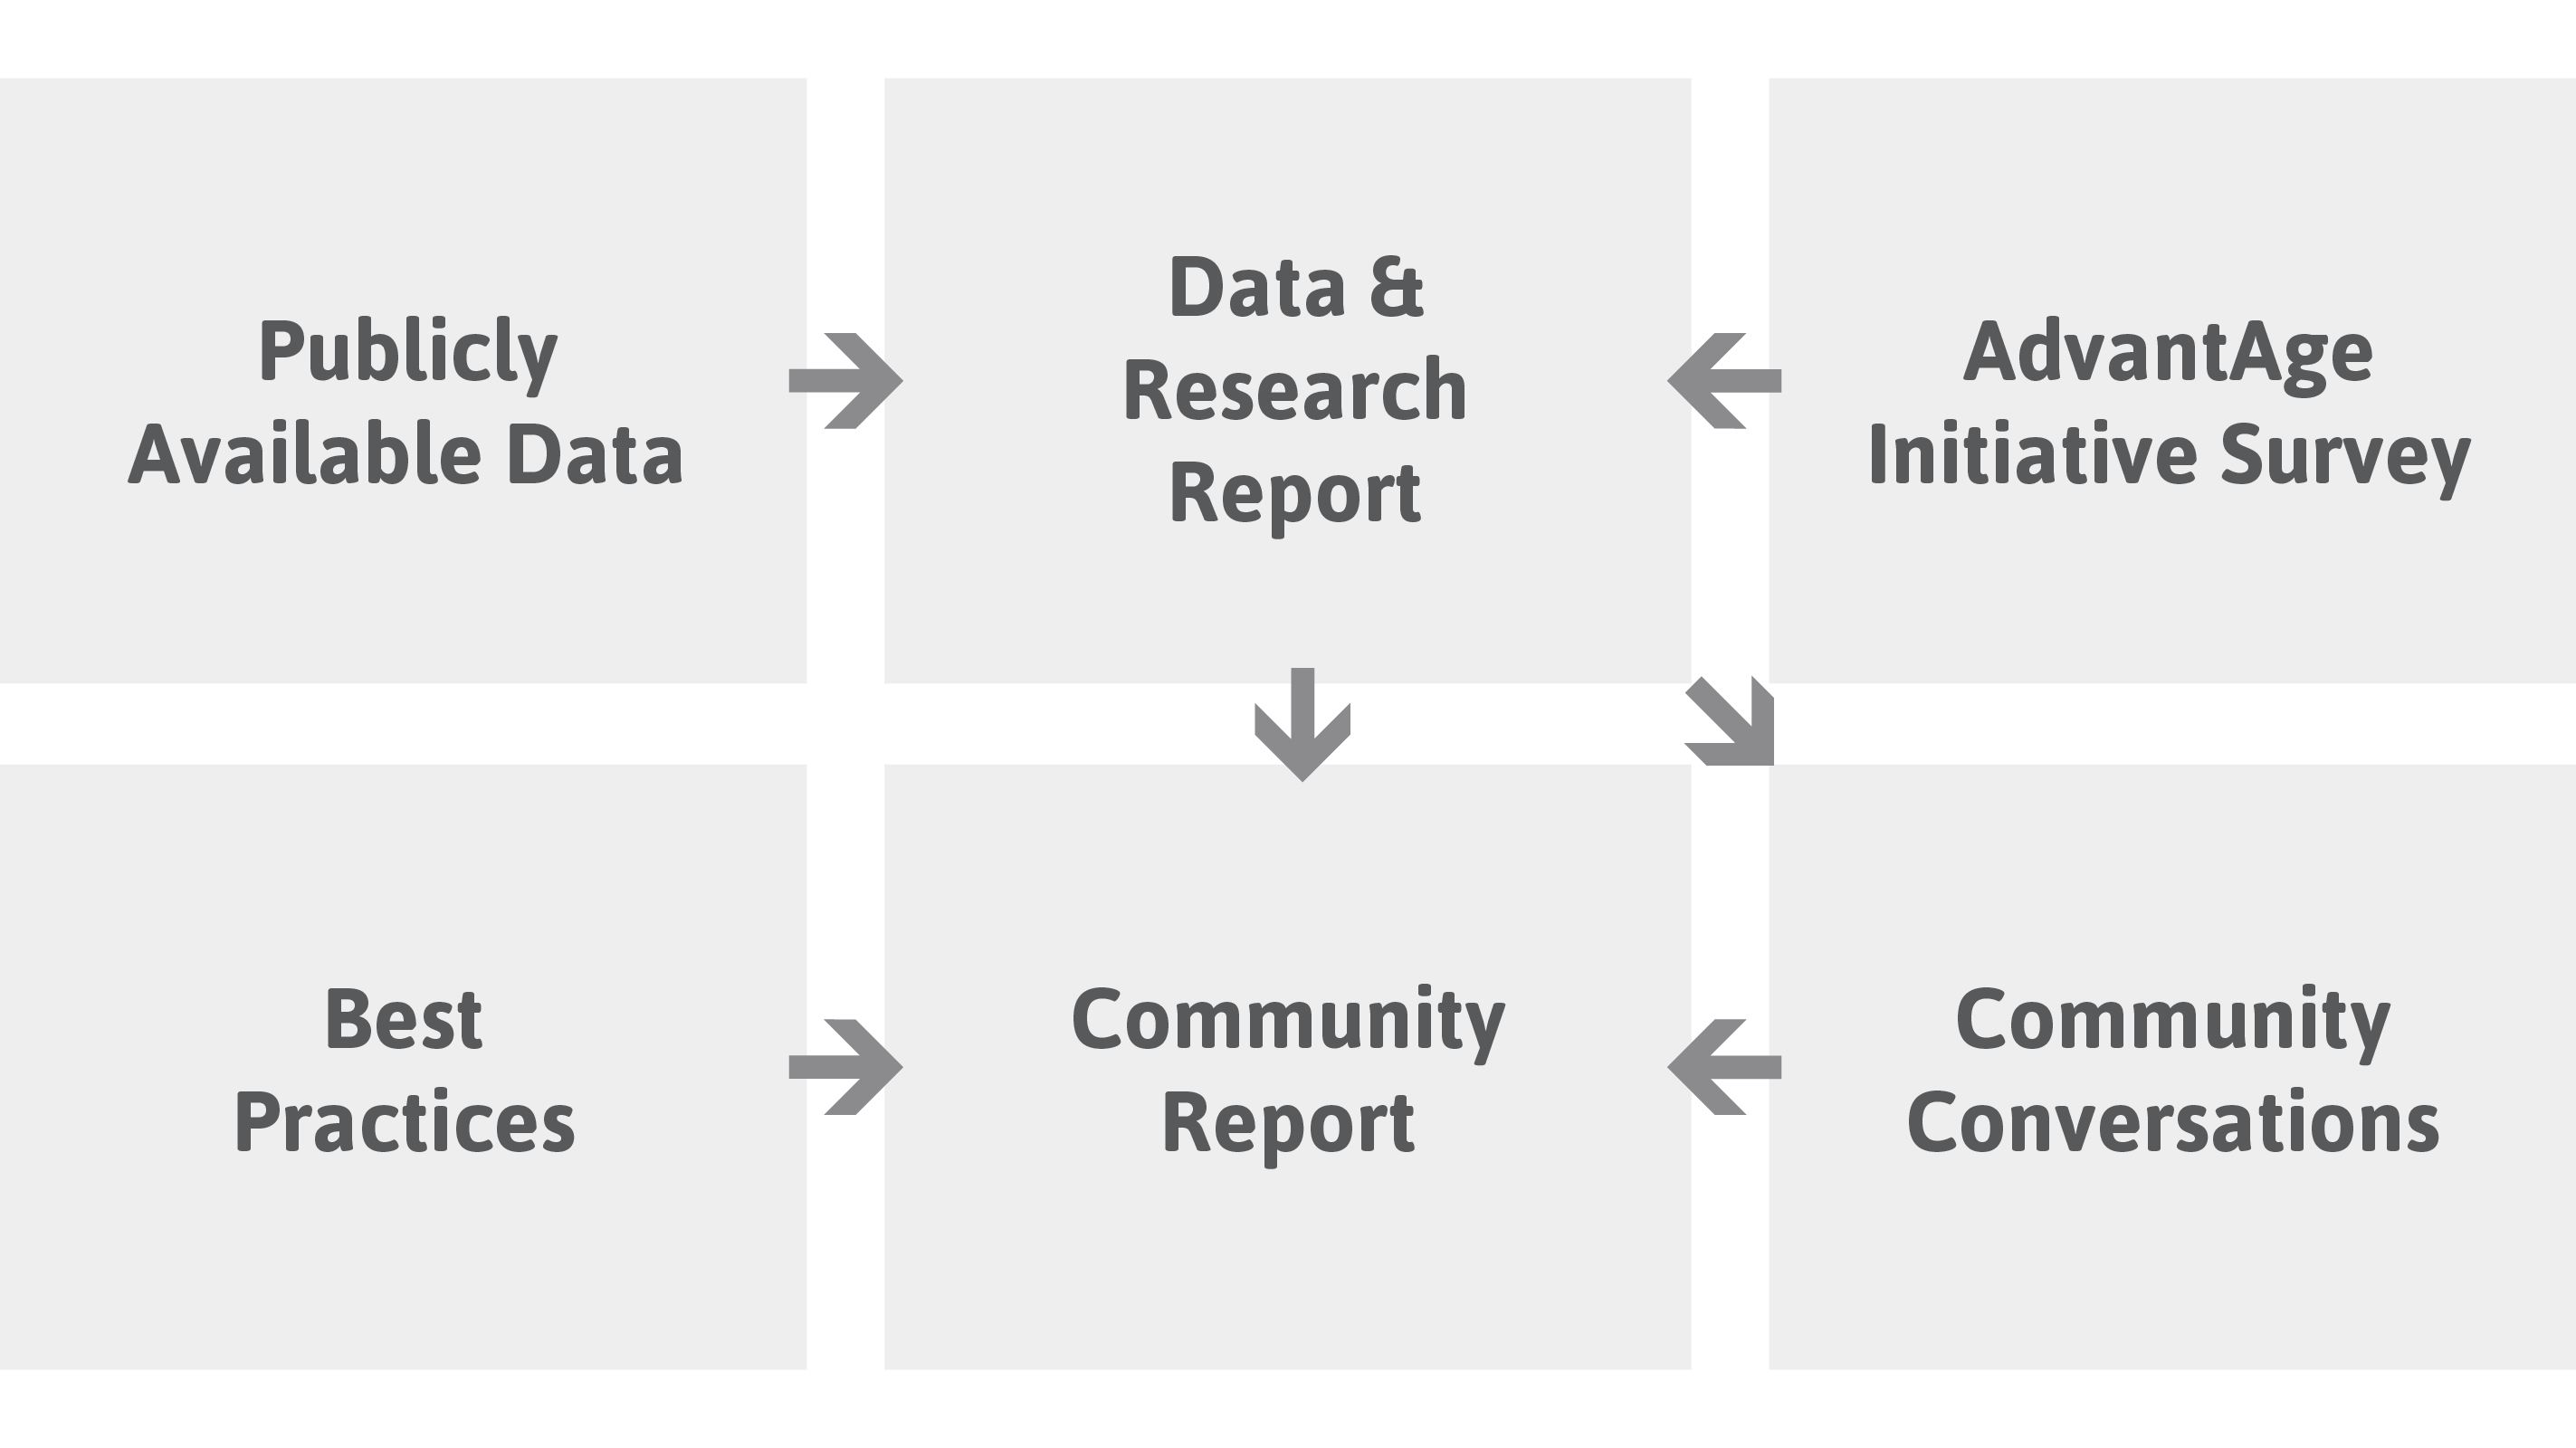
A data and research report, which included preliminary findings from the research process was presented to all committees and work groups. Preliminary findings helped inform questions posed to the community through three Community Conversations events. The Community Conversations provided direct community perspective from 120 additional community members.
Research Focus
The Outcome Framework was developed through research and work group collaboration, and includes components related to aging within a community. Outcome areas are broken down into outcome factors, which are general topics that relate to the outcome area. Outcome factors are then broken down into indicators. Indicators provide a measure of a given condition and were chosen in collaboration with professionals in data and research fields. Indicators for this report are based on publicly available data, and primary data collected through the random-sample surveying of adults aged 60 and older.


The Research Framework was developed through community collaboration; it shines a light on the conditions that affect aging in Forsyth County.
Note on Data and Research
Data presented on this website is about adults aged 60 and older in Forsyth County and are approximations. The data sources include publicly available data, such as the census, as well as weighted results from a random-sample telephone survey of 1002 adults aged 60 and older that was developed by the AdvantAge Initiative. Results from Community Conversations, and significant differences occurring in data points are spread throughout each outcome area and are identified by the icons below.


Data Disaggregation
Race/Ethnicity
African American and White are the two largest racial groups. All other racial groups were about 2% of the population and are not included as data from a subgroup of this size is unreliable.
Ethnicity is not included; the population who are of Hispanic or Latino origin was only about 2%.
Gender
Male and Female are the largest gender groups. All other gender groups were less than 1% of the population and are not included in analysis.
Income
Income is broken down into three groups:
• low-income (high risk) — aging adults making less than $20,000 per year
• middle-income (potential risk: would be at risk if a life changing event occurred)— aging adults making more than $20,000 but less than $35,000 per year
• high-income (low risk) — aging adults making more than $35,000 per year
Age
Age is broken down into three groups, 60-64, 65-74, and 75+.