Morbidity and Mortality
Morbidity and Mortality examines pain prevalence and personal health perception among aging adults, life expectancy as a measure of mortality, and falls that resulted in injury.
Indicators:
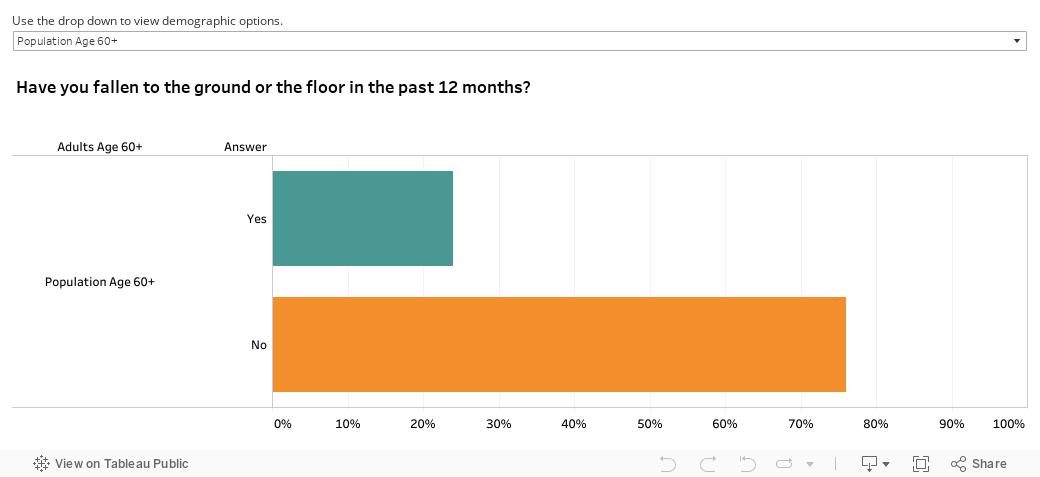

When we look at the data by age and income, we see that adults aged 65-74 and high-income aging adults reported less falls compared to other age groups, and income groups, respectively.
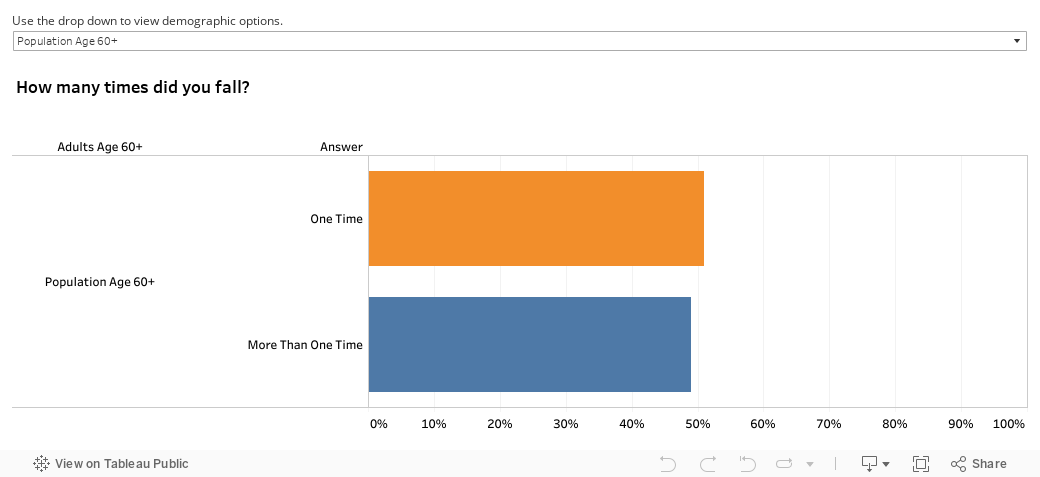
When we look at fall frequency, African Americans, low-income, and high-income aging adults had more falls compared to the White population, and middle-income aging adults, respectively.
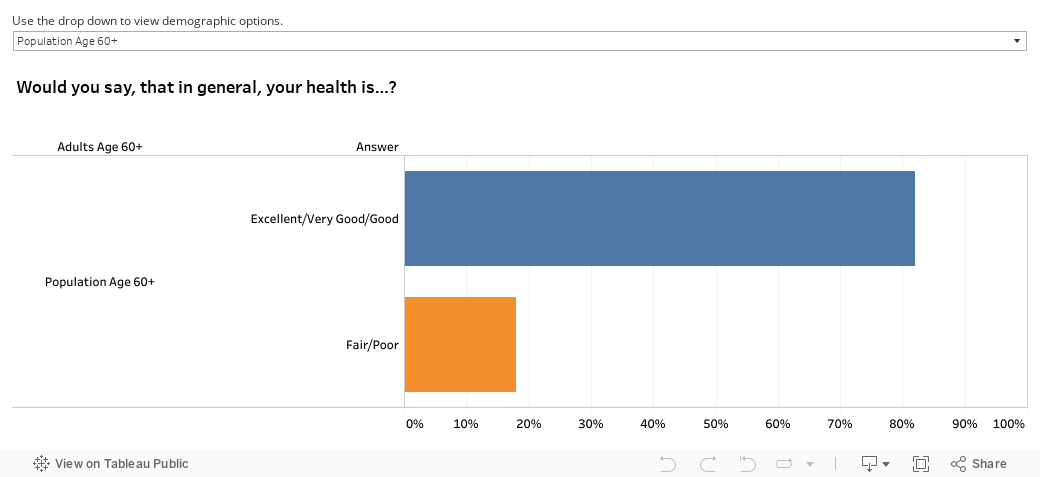
When we look at the data by race and income, we see that African Americans and low-income aging adults have higher rates of negative health perception compared to the White population, and other income groups, respectively.
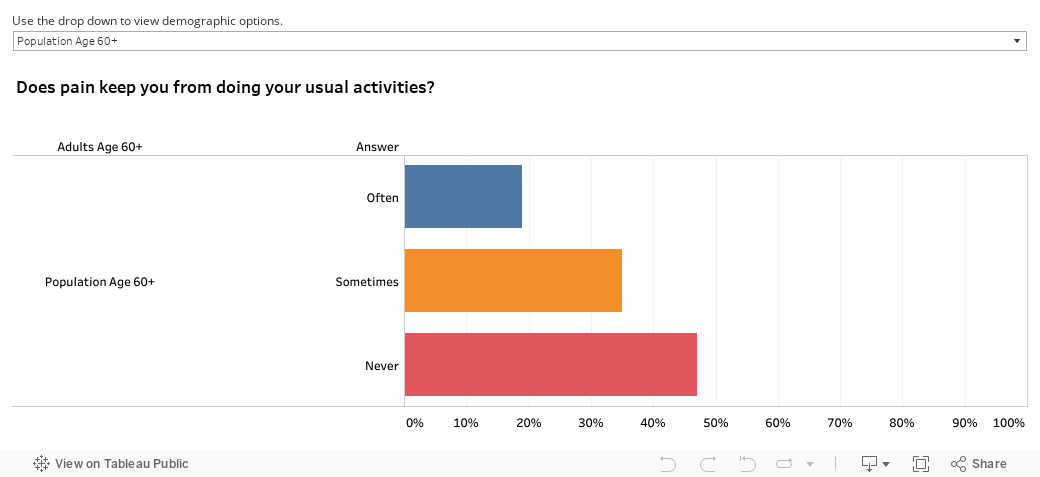
When we look at the data by age and income, we see that adults aged 60-64 and low-income aging adults have a higher percentages reporting that they often experience pain compared to other age groups, and income groups, respectively.
| Age | Total | Male | Female | White | African American |
|---|---|---|---|---|---|
| 60-64 Years | 22.8 | 21.1 | 24.2 | 23.2 | 21.4 |
| 65-69 Years | 19 | 17.6 | 20.2 | 19.3 | 18 |
| 70-74 Years | 15.4 | 14.2 | 16.3 | 15.6 | 14.8 |
| 75-79 Years | 12.1 | 11 | 12.8 | 12.1 | 12.1 |
| 80-84 Years | 9.1 | 8.3 | 9.5 | 9.1 | 9.2 |
| 85+ Years | 6.5 | 6 | 6.7 | 6.3 | 7.1 |
The table above depicts the life expectancy (in years) for adults aged 60 and older.